When it comes to identifying and resolving software issues, Visual Studio’s diagnostic tools are an invaluable asset. Enabling these tools during debugging provides real-time insights into your application’s performance, memory usage, and overall behavior. This guide will walk you through the process of enabling and effectively utilizing Visual Studio’s diagnostic tools to streamline your debugging workflow.
Understanding the Importance of Diagnostic Tools
Before diving into the “how-to,” let’s grasp “why” these tools are essential for developers. Imagine this: you’re facing a performance bottleneck or a memory leak in your code. Instead of spending hours sifting through lines of code, diagnostic tools act like an x-ray for your application, revealing the root cause of the problem quickly and efficiently.
By providing real-time data visualization and analysis, these tools empower you to:
- Pinpoint performance bottlenecks: Identify functions or code segments that are consuming excessive resources, hindering your application’s speed.
- Detect and diagnose memory leaks: Track memory allocation and deallocation to uncover areas in your code that are not releasing memory properly.
- Analyze CPU usage: Understand how your application utilizes processor cores, helping you optimize for better multi-threading and responsiveness.
- Visualize data flow: Track the movement of data through your application, making it easier to identify logic errors and data inconsistencies.
Enabling Diagnostic Tools in Visual Studio
Enabling diagnostic tools in Visual Studio is a straightforward process:
- Open your project: Launch Visual Studio and open the project you want to debug.
- Access Diagnostic Tools: Navigate to the “Debug” menu and select “Windows” -> “Show Diagnostic Tools.”
- Select Tools to Enable: You will see various tools such as CPU Usage, Memory Usage, Events, and more. Check the boxes next to the tools you want to activate.
- Start Debugging: Begin debugging your application as you usually would by pressing F5 or clicking the “Start Debugging” button.
Exploring Key Diagnostic Tools
Visual Studio offers a suite of powerful diagnostic tools. Let’s explore some of the most frequently used ones:
CPU Usage
The CPU Usage tool is your go-to for identifying performance bottlenecks. It provides a graphical representation of your application’s CPU consumption over time. By analyzing the peaks and valleys in the graph, you can pinpoint functions or code sections demanding excessive CPU time.
Memory Usage
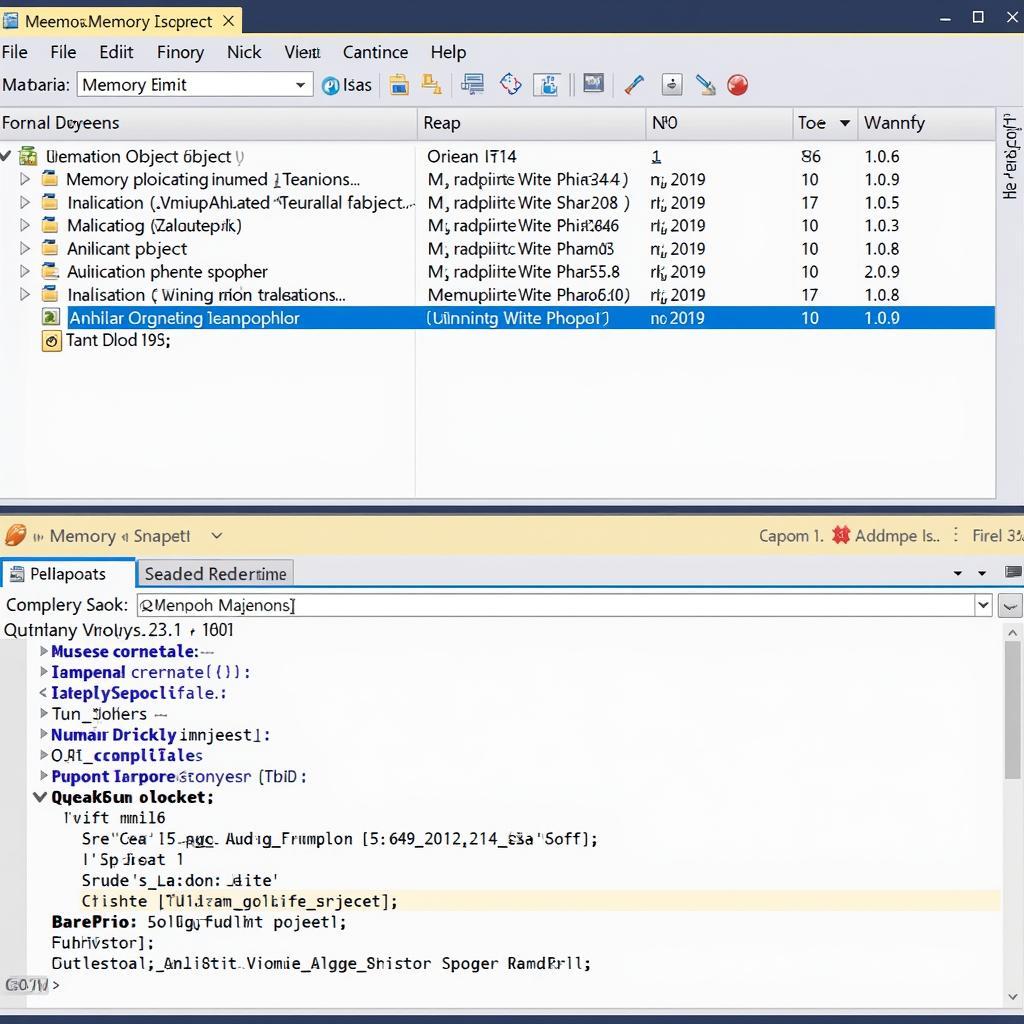
Memory leaks are a common source of application instability. The Memory Usage tool helps you monitor your application’s memory allocation and identify potential leaks. By taking snapshots of the heap and comparing them over time, you can detect objects that are not being garbage collected properly.
 Visual Studio Memory Usage Tool
Events
The Events tool captures a chronological log of events related to your application’s execution. This includes events like module loads, thread creation, exceptions, and more. By filtering and analyzing these events, you can gain valuable insights into the sequence of operations leading up to a particular issue.
Breakpoints and Tracepoints
While not strictly diagnostic tools, breakpoints and tracepoints are essential for effective debugging. Breakpoints allow you to pause execution at specific code lines, while tracepoints let you log messages or data values without interrupting the program’s flow.
Advanced Tips for Efficient Debugging
Here are some advanced tips to enhance your debugging experience:
- Use Conditional Breakpoints: Instead of pausing execution every time a breakpoint is hit, set conditions to pause only when specific criteria are met, significantly speeding up your debugging process.
- Leverage Tracepoints for Logging: Instead of littering your code with
Console.WriteLinestatements, use tracepoints to log data and messages directly within the debugger, providing a cleaner and more efficient debugging experience. - Analyze Performance with PerfTips: PerfTips are small performance hints that appear directly within your code editor during debugging. They display the execution time of code segments, allowing you to quickly identify performance bottlenecks without leaving your code.
- Customize Diagnostic Tools Layout: Visual Studio allows you to customize the layout of the Diagnostic Tools window to suit your preferences. Arrange the tools you use most frequently in a way that optimizes your workflow.
Common Issues and Troubleshooting
Even with the best tools, you might encounter some hiccups. Here’s a rundown of common issues and how to troubleshoot them:
“Diagnostic Tools window not showing”
- Ensure Tools are Enabled: Double-check that you have enabled the specific diagnostic tools you want to use within the “Diagnostic Tools” settings.
- Restart Visual Studio: Sometimes, a simple restart can resolve display issues with the Diagnostic Tools window.
- Check for Conflicting Extensions: Certain Visual Studio extensions might interfere with the Diagnostic Tools window. Try disabling recently installed extensions to see if they are the culprit.
diagnostic tools window visual studio 2019
“Data not being collected”
- Verify Project Configuration: Ensure that your project is configured to generate debug symbols, which are essential for the diagnostic tools to collect data.
- Check Debugging Mode: Confirm that you are running your application in “Debug” mode and not “Release” mode. Diagnostic tools typically collect detailed data only in Debug mode.
- Disable Optimization Settings: Compiler optimizations can sometimes interfere with data collection. Try temporarily disabling any aggressive optimization settings in your project’s build configuration.
visual studio 2019 diagnostic tools not showing
Conclusion
Visual Studio’s diagnostic tools are indispensable for efficient debugging. By understanding how to enable, utilize, and troubleshoot these tools, you can significantly reduce the time it takes to identify and resolve software defects, ultimately leading to more robust and higher-quality applications. Remember to explore the various tools, experiment with their features, and customize your debugging environment to best suit your needs.
If you need further assistance in diagnosing and resolving car issues using professional-grade diagnostic tools, ScanToolUS is here to help. Contact us at +1 (641) 206-8880 or visit our office at 1615 S Laramie Ave, Cicero, IL 60804, USA.
turn off diagnostic tools visual studio 2017
FAQ
1. Can I use Visual Studio’s diagnostic tools with any programming language?
While the specific features and tools available may vary, Visual Studio generally supports debugging and diagnostic tools for a wide range of programming languages, including C#, C++, JavaScript, Python, and more.
2. Does enabling diagnostic tools slow down my application during debugging?
Enabling diagnostic tools does introduce some overhead, as data collection and analysis require resources. However, the impact is usually minimal and outweighed by the benefits of faster and more effective debugging.
3. Is it possible to analyze performance data after my application has finished running?
Yes, Visual Studio allows you to save diagnostic sessions. You can then reload and analyze this data later, even if the application is no longer running. This is particularly useful for examining performance issues that occurred in production environments.
4. Are there any external tools that integrate well with Visual Studio for advanced diagnostics?
Yes, several third-party tools and extensions enhance Visual Studio’s diagnostic capabilities. These tools often specialize in specific areas like memory profiling, performance analysis, or code coverage.
5. How can I learn more about effectively utilizing Visual Studio’s diagnostic tools?
Microsoft offers comprehensive documentation and tutorials on Visual Studio’s debugging and diagnostic features. Additionally, various online resources, courses, and communities focus on .NET development and debugging techniques.


