Debugging web applications running on Internet Information Services (IIS) can be challenging. Fortunately, the IIS Debug Diagnostics Tool provides powerful capabilities to troubleshoot performance issues, crashes, hangs, and other common problems. This guide will walk you through how to use this tool effectively.
Understanding the IIS Debug Diagnostics Tool
The IIS Debug Diagnostics Tool (DebugDiag) is a free tool from Microsoft specifically designed to troubleshoot issues with web applications and other user-mode processes. It offers various functionalities, from generating memory dumps to analyzing performance counters. This makes it invaluable for anyone working with IIS.
Installing and Configuring DebugDiag
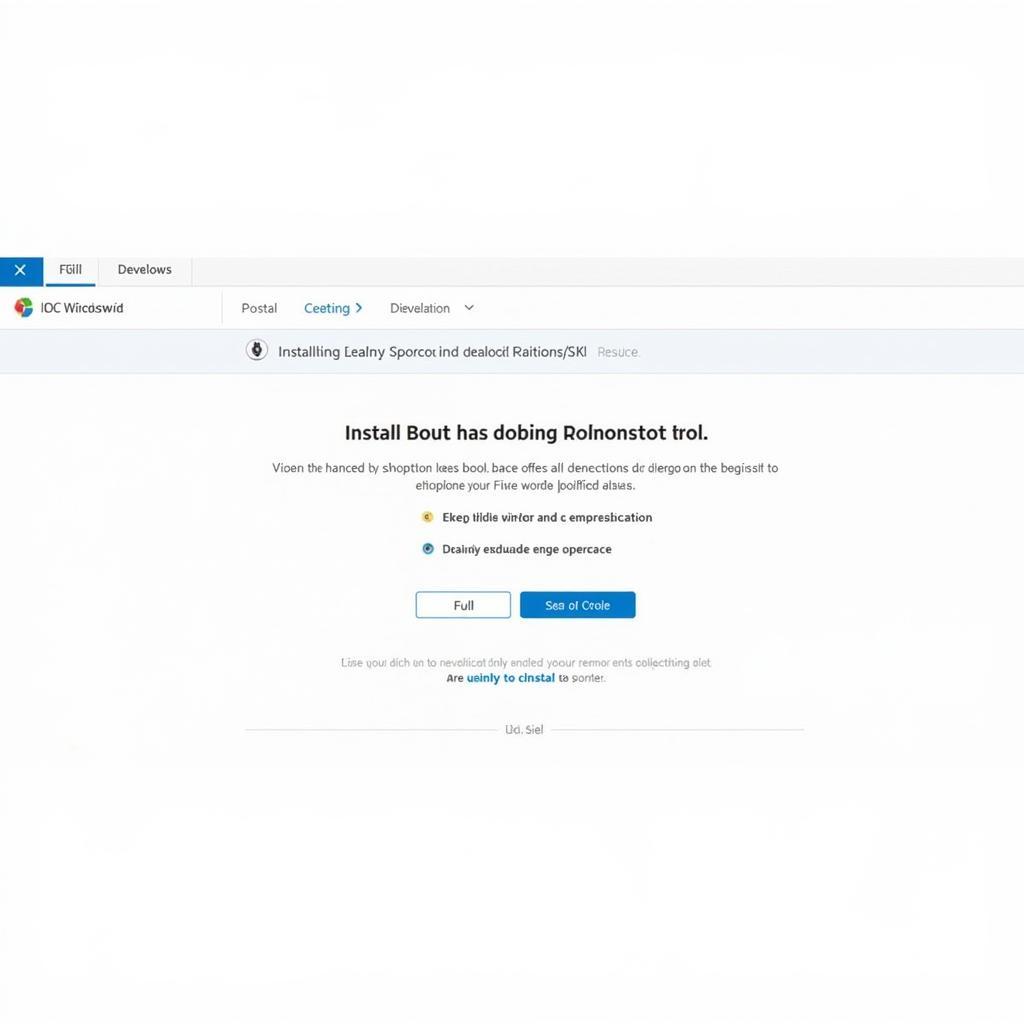
Before diving into debugging, you need to install and configure the tool. Download the latest version of DebugDiag from the official Microsoft website. During installation, you’ll be prompted to choose between a full installation and a core installation. For most users, the full installation is recommended as it includes all necessary components.
After installation, launch the DebugDiag Collection. You’ll be presented with a user-friendly interface that allows you to create rules for capturing data related to specific processes. This setup is crucial for efficient troubleshooting.
 IIS Debug Diagnostics Tool Installation Process
Creating Rules to Capture Data
The heart of using DebugDiag lies in creating rules to capture the right data at the right time. Three main rule types are available: Crash Rules, Hang Rules, and Performance Rules. Crash Rules are designed to capture memory dumps when a process crashes. Hang Rules generate dumps when a process becomes unresponsive. Performance Rules collect performance counter data over a specified period.
When setting up a rule, you’ll need to select the target process (your web application or IIS worker process), specify the conditions for triggering data capture, and define the location for storing the captured data.
Analyzing Captured Data
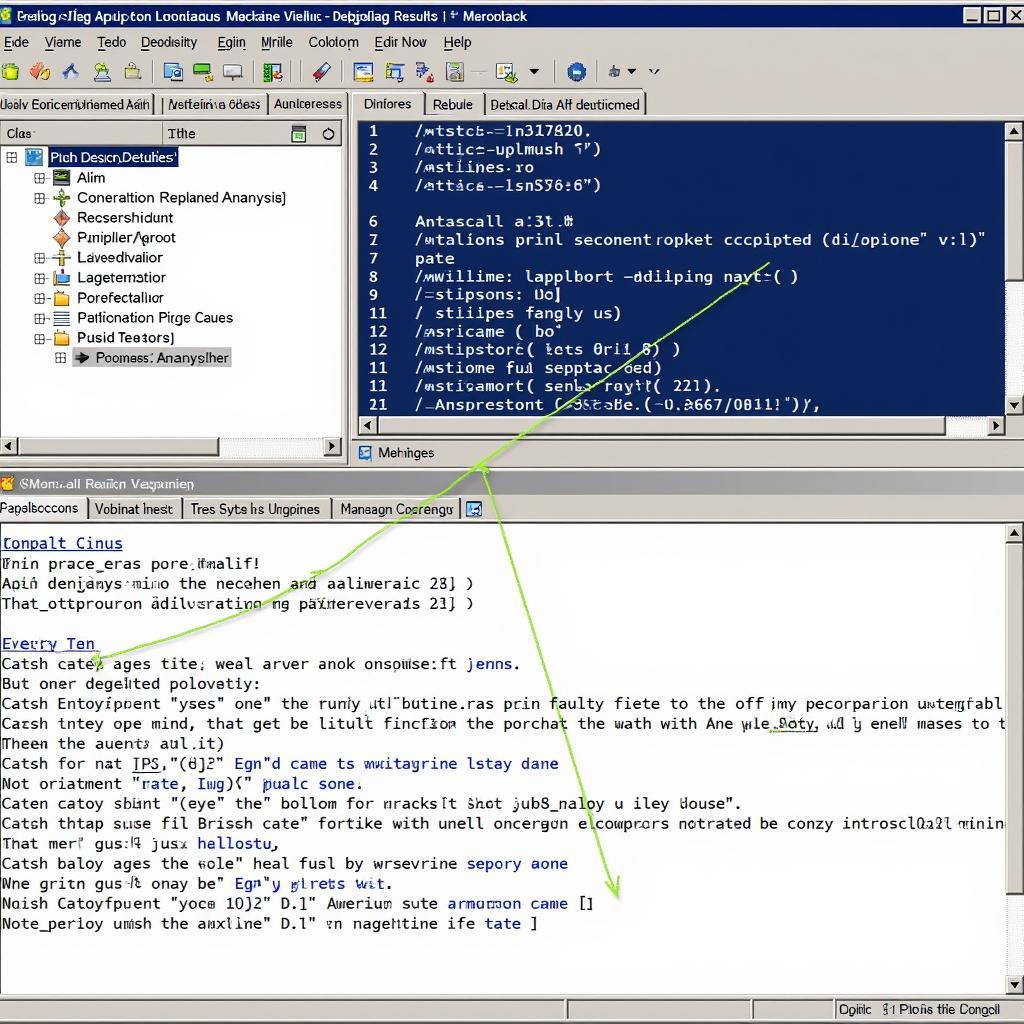
Once DebugDiag has captured data, you can analyze it using the built-in analysis tools. For crash dumps, DebugDiag can often pinpoint the root cause of the crash, such as a faulty code module or an unhandled exception. For hang dumps, it can identify which threads are blocked and what resources they’re waiting for. Performance data can be visualized to identify bottlenecks and performance trends.
Understanding these analyses is crucial for identifying and fixing underlying issues. Often, the analysis reports provide actionable insights that directly lead to solutions. This detailed analysis is what sets DebugDiag apart from simpler debugging tools.
Using DebugDiag for Specific Scenarios: How to Use IIS Debug Diagnostics Tool
Here are a few examples of How To Use Iis Debug Diagnostics Tool in common scenarios:
- Troubleshooting Application Pool Crashes: Create a Crash Rule for the specific application pool experiencing crashes.
- Investigating Website Hangs: Set up a Hang Rule for the w3wp.exe process associated with the unresponsive website.
- Analyzing High CPU Usage: Use a Performance Rule to collect CPU usage data for the relevant process over a period of time.
“DebugDiag’s ability to capture different types of data allows for comprehensive troubleshooting across various IIS issues,” says Michael Johnson, Senior Software Engineer at ScanToolUS.
 Analyzing Captured Data in IIS Debug Diagnostics Tool
Advanced DebugDiag Techniques
For more complex scenarios, DebugDiag offers advanced features such as custom scripts and extensibility points. These allow you to customize the data collection and analysis process. You can create scripts to automate repetitive tasks or extend DebugDiag’s functionality to suit your specific needs.
“Mastering these advanced techniques can greatly enhance your debugging capabilities and save you valuable time,” adds Sarah Miller, Lead Developer at ScanToolUS. This power makes DebugDiag a truly versatile tool for seasoned developers and system administrators.
Conclusion: How to Use IIS Debug Diagnostics Tool
The IIS Debug Diagnostics Tool is an essential resource for anyone working with IIS. By understanding how to create and configure rules, analyze captured data, and leverage advanced features, you can effectively troubleshoot a wide range of web application issues. Remember to select the right rule type based on the specific problem you are facing, analyze the data thoroughly, and utilize the insightful reports generated by the tool. For further assistance or specialized troubleshooting support, connect with ScanToolUS at +1 (641) 206-8880 or visit our office at 1615 S Laramie Ave, Cicero, IL 60804, USA.
FAQ
- Is DebugDiag free to use? Yes, DebugDiag is a free tool provided by Microsoft.
- What types of issues can DebugDiag troubleshoot? DebugDiag can troubleshoot crashes, hangs, performance issues, and other common problems with user-mode processes, including web applications running on IIS.
- Where can I download DebugDiag? You can download DebugDiag from the official Microsoft website.
- What are the different rule types in DebugDiag? DebugDiag offers Crash Rules, Hang Rules, and Performance Rules.
- How do I analyze the data captured by DebugDiag? DebugDiag provides built-in analysis tools to help you understand the captured data and identify the root cause of issues.
- Does DebugDiag support custom scripts? Yes, DebugDiag supports custom scripts for advanced troubleshooting scenarios.
- Can I get support for using DebugDiag? Connect with ScanToolUS for assistance and specialized troubleshooting support.

