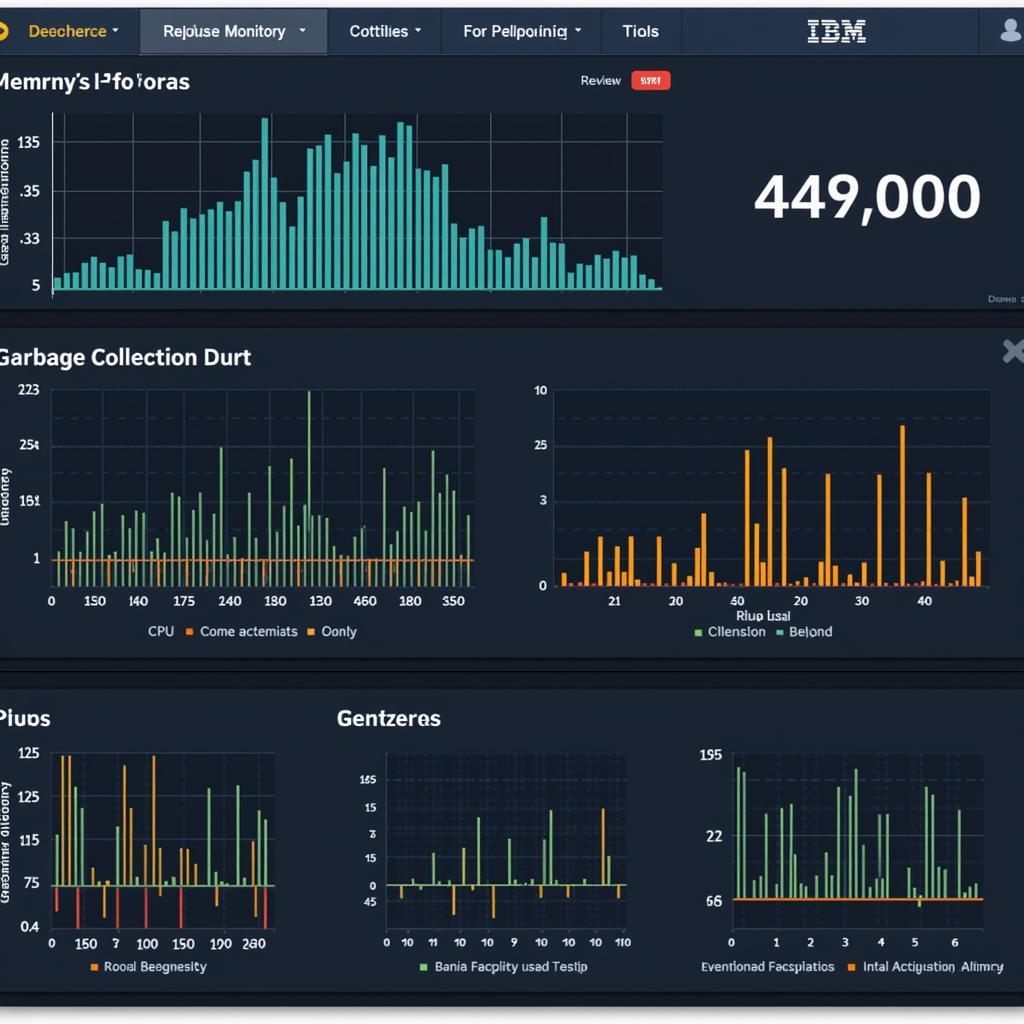
The Debug Diagnostics Tool V1.2 is a powerful utility designed to troubleshoot a wide array of issues in Windows applications, including crashes, hangs, slow performance, and memory leaks. This comprehensive guide will delve into the tool’s capabilities, benefits, and provide a step-by-step walkthrough on how to effectively utilize it for diagnosing and resolving software problems.
Understanding the Power of Debug Diagnostics Tool v1.2
Whether you’re an IT professional, a software developer, or simply a tech-savvy individual, encountering software glitches can be frustrating. The Debug Diagnostics Tool v1.2 empowers you to take charge and pinpoint the root cause of these problems. Let’s explore the core features that make this tool indispensable:
-
Process Monitoring: The tool allows you to monitor specific processes in real-time, observing their behavior, resource consumption, and any unusual activities. This feature is crucial for identifying processes responsible for performance bottlenecks or system instability.
-
Crash Rule Configuration: One of the most valuable aspects of the Debug Diagnostics Tool v1.2 is its ability to automatically capture critical information during application crashes. You can configure specific rules to generate comprehensive crash dumps, capturing the state of the application and system at the time of failure. These dumps provide invaluable insights for debugging and fixing crashes.
-
Memory Leak Detection: Memory leaks are a common culprit behind slow performance and application instability. The Debug Diagnostics Tool v1.2 includes powerful memory leak detection capabilities. It can track memory allocations and identify patterns that indicate potential leaks. This information helps developers optimize their code and prevent memory-related issues.
-
Offline Analysis: The tool allows you to analyze crash dumps and other diagnostic information offline. This means you can collect data on a problematic system and then analyze it on a different machine, providing flexibility and convenience for troubleshooting.
How to Use Debug Diagnostics Tool v1.2: A Step-by-Step Guide
Now, let’s dive into a practical guide on how to effectively use the Debug Diagnostics Tool v1.2:
-
Download and Installation:
- Download the Debug Diagnostics Tool v1.2 from the official Microsoft website. Ensure you choose the correct version compatible with your operating system (32-bit or 64-bit).
- Run the installer and follow the on-screen instructions.
-
Launching the Tool:
- Once installed, locate the Debug Diagnostics Tool v1.2 in your start menu and launch it.
-
Creating a Rule:
- To begin troubleshooting a specific issue, you need to create a rule. Click on the “Rules” tab and select “Add Rule.”
- Choose the type of rule that aligns with your problem. For instance, select “Crash” for application crashes or “Performance” for performance bottlenecks.
- Specify the target process you want to monitor or analyze.
- Configure rule-specific options, such as crash dump location and memory leak detection settings.
-
Collecting Data:
- Once your rule is configured, start it to begin collecting diagnostic data. The tool will run in the background, monitoring your specified process or system behavior.
- If you’re troubleshooting a crash, reproduce the crash while the rule is active. The tool will automatically generate a crash dump.
- For performance issues, let the system run under typical load conditions to gather relevant data.
-
Analyzing the Results:
- After collecting sufficient data, stop the rule and review the generated reports.
- The tool provides detailed analysis of crash dumps, performance logs, and memory snapshots.
- Utilize the built-in analysis tools or consult online resources to interpret the results and identify the root cause of the problem.
cpu z diagnostic tool can also be a valuable resource in conjunction with the Debug Diagnostics Tool, providing complementary system information to aid in your troubleshooting endeavors.
Advanced Tips for Effective Debugging
-
Symbol Paths: Configure symbol paths correctly to ensure proper resolution of function names and call stacks in crash dumps. This step is crucial for accurate debugging.
-
Rule Customization: Don’t hesitate to customize rule settings to match your specific needs. Adjust data collection parameters and dump file locations as required.
-
Process Explorer Integration: Leverage the integration between Debug Diagnostics Tool v1.2 and Process Explorer, another powerful system utility. Use Process Explorer to identify problematic processes and seamlessly attach the debugger for deeper analysis.
-
Community Resources: Utilize online forums, knowledge bases, and communities dedicated to debugging and software troubleshooting. These resources can provide valuable insights, workarounds, and solutions to common problems.
Conclusion
The Debug Diagnostics Tool v1.2 is an indispensable asset for anyone involved in software development, system administration, or simply resolving frustrating computer problems. By mastering its features and following the steps outlined in this guide, you’ll be well-equipped to diagnose and fix a wide range of software issues, saving you time, effort, and frustration.
If you need further assistance or expert guidance in utilizing diagnostic tools to troubleshoot your automotive or software issues, don’t hesitate to contact ScanToolUS at +1 (641) 206-8880. Our team of experienced technicians is ready to assist you. You can also visit our office at 1615 S Laramie Ave, Cicero, IL 60804, USA.


