The Debug Diagnostic Tool v1.2 is a powerful, free utility offered by Microsoft that can be invaluable when troubleshooting automotive software and hardware issues on a Windows 10 platform. It allows users to gather data and analyze crashes, hangs, excessive memory usage, and performance bottlenecks in a variety of applications, including those crucial for diagnosing vehicle problems.
Why Use Debug Diagnostic Tool v1.2?
Automotive repair shops and individual technicians are increasingly reliant on software programs for diagnostics, tuning, and component analysis. When these programs encounter issues, the Debug Diagnostic Tool v1.2 can be instrumental in pinpointing the root cause. It offers several key advantages:
- Detailed Crash Analysis: The tool captures detailed information about application crashes, including memory dumps, which can help identify the specific code or component causing the failure.
- Performance Monitoring: Analyze CPU and memory usage over time, identifying resource hogs and potential bottlenecks that might be slowing down your automotive software.
- Process Investigation: Examine running processes in detail, including their threads, memory allocation, and handles. This can help diagnose hangs or freezes.
- Script Automation: Automate debugging tasks using scripts, allowing for consistent data collection and analysis, particularly useful for recurring issues.
Getting Started with Debug Diagnostic Tool v1.2 on Windows 10
-
Download and Install: The Debug Diagnostic Tool v1.2 is available as a free download from the Microsoft website. Ensure you select the correct version for your Windows 10 operating system (32-bit or 64-bit).
-
Launch the Tool: After installation, locate and launch the Debug Diagnostic Tool v1.2 from the Start Menu.
-
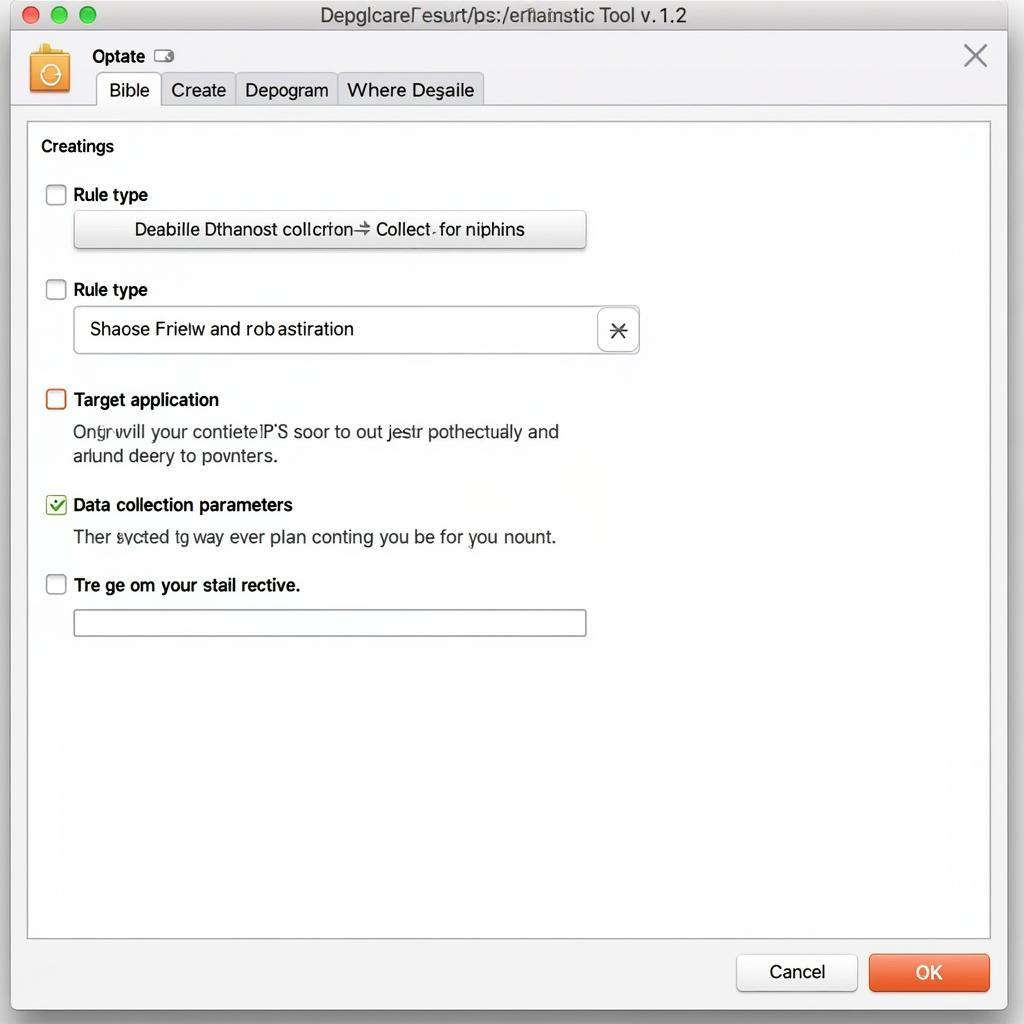
Select a Rule Type: The tool offers several pre-configured rule types for common debugging scenarios. For automotive applications, “Crash” or “Performance” rules are often most relevant.
-
Configure the Rule: Select the specific application executable (.exe) that you want to monitor. For performance issues, you can set thresholds for CPU and memory usage that will trigger data collection.
-
Activate the Rule: Once configured, activate the rule. The Debug Diagnostic Tool v1.2 will now run in the background, monitoring your chosen application.
 Debug Diagnostic Tool Interface
Analyzing Debug Diagnostic Data
After a crash or performance issue occurs, the Debug Diagnostic Tool v1.2 will generate detailed logs and reports. These reports often provide specific recommendations for resolving the problem.
-
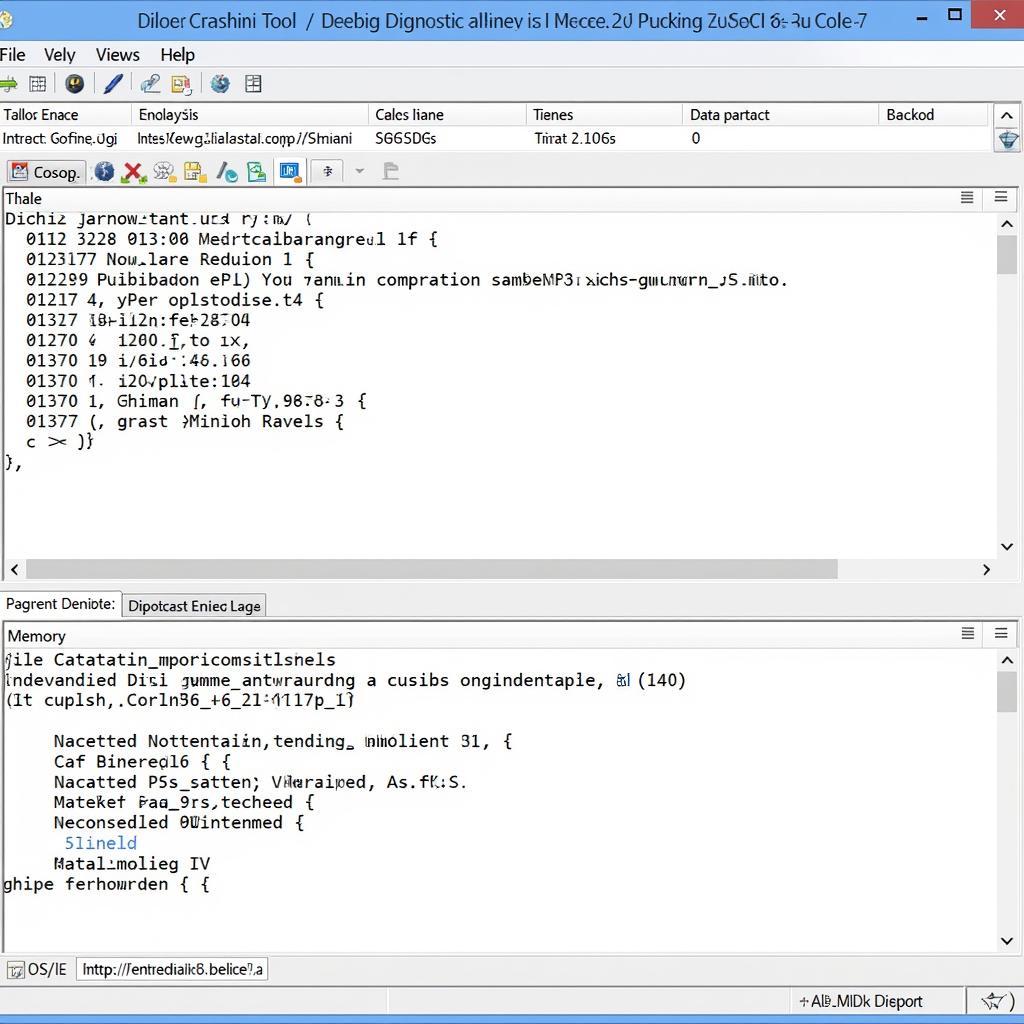
Analyzing Crash Dumps: Crash dumps (.dmp files) contain a snapshot of the application’s memory at the time of the crash. These files can be analyzed within the tool or using other debuggers like WinDbg to identify the faulty code.
-
Interpreting Performance Logs: Performance logs provide graphs and statistics on CPU and memory usage. Look for spikes or trends that coincide with the performance problems you’re experiencing.
-
Utilizing Symbols: Symbol files (.pdb) help match the raw data in crash dumps and logs to human-readable code, making analysis significantly easier. Ensure you have the appropriate symbol files for your automotive software.
 Analyzing a Crash Dump
Tips for Effective Automotive Troubleshooting
-
Start Simple: Before diving into advanced debugging, rule out basic issues like connectivity problems, driver conflicts, or incorrect software settings.
-
Reproduce the Issue: Consistently replicating the problem is key to successful debugging. Document the exact steps or conditions that trigger the issue.
-
Update Drivers and Software: Ensure your automotive diagnostic software, operating system, and device drivers are up to date.
-
Consult Documentation: Refer to the documentation for your specific automotive software and hardware. It may provide troubleshooting tips or known issue workarounds.
-
Seek Support: Don’t hesitate to contact the software vendor or experienced technicians for assistance if you’re unable to resolve the problem independently.
“When dealing with complex automotive software issues, the Debug Diagnostic Tool is an essential part of my toolkit. It allows me to quickly gather the data I need to pinpoint the root cause and get my clients’ vehicles back on the road.” – John Miller, Senior Automotive Technician
Conclusion
The Debug Diagnostic Tool v1.2 is an invaluable asset for anyone working with automotive software on Windows 10. Its ability to analyze crashes, monitor performance, and provide detailed diagnostic information can save countless hours of frustration and get your automotive systems running smoothly. By understanding its capabilities and following these best practices, you can significantly enhance your troubleshooting process.
For assistance with automotive diagnostic tools and software, contact ScanToolUS at +1 (641) 206-8880 or visit our office at 1615 S Laramie Ave, Cicero, IL 60804, USA.

